Test Campaign Data Reduction
Processing the data after a test is sometimes more important than the test itself especially when something is off-nominal. This simple code allows me to have a look at all our results and make data driven decisions on what we must improve on for the next test.Overview
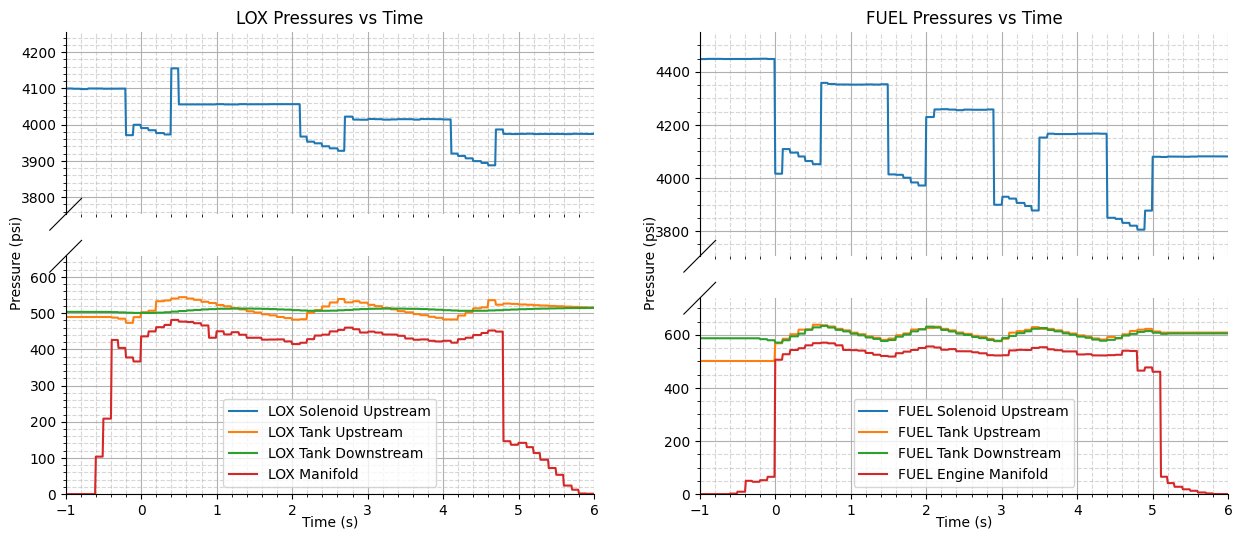
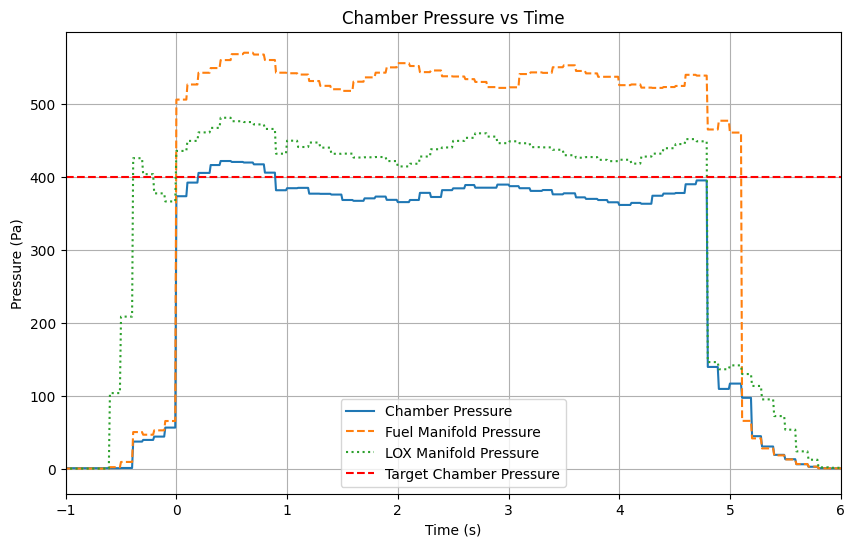
This code is very simple, it takes in the csv file of all the data we gather from our pressure transducers, thermocouples and load cells and generates pre planned plots based on what data we believe is necessary to look at. It also calculates certain parameters for the engine and feed system to analyse efficiency among other things. For example from the venturi flow meter pressure drop we can find mass flows which, coupled with engine pressure can give us the characteristic velocity of the exhaust and by extension the engine's C* efficiency.
For improvements for next hot fires, the code also calculates the CdA of the system and provides set pressures to ensure correct mass flow rates to the engine.
*Note: The reason there is a fluctuation in our pressures is because we utilise a bang bang system to provide steady pressures unlike the droop experienced with regulators.
My files
To take a further look at my simple post processing code, the link below will take you to my GitHub repository.